
- Snoring Detection
Snoring is a sleep disorder that can negatively affect a person's quality of life.- The main reason for snoring is that the throat muscles relax during sleep, causing the airways to narrow and make a sound. .To detect snoring, we use a convolutional neural network (CNN), a deep learning algorithm that can process and analyze high-quality data such as images and sounds. We preprocess the audio data into spectrograms, which are visual representations of the audio parameters. Spectrograms are useful for analyzing audio data as they allow us to see the frequency content of a sound over time. The spectrogram is a graphical representation of signals. This enables easier visualization of signals. It represents the spectral change of signal with respect to time.
- The X-axis denotes the frequency of the signal and Y-axis represents the time of the signal and the intensity of pixels denotes the corresponding magnitude or power. The architecture of the CNN model used in this project consists of two convolutional layers, two max-pooling layers, and two dense layers. The input to the model is the spectrogram of the voice and the data fed into the network is of size (128,44,1). The first convolutional layer has 16 filters of filter size (3X3). Followed by a max-pooling layer of size (2x2). In the second Convolutional layer, 32 filters of size (3X3) are convolved followed by a max-pooling layer of (2X2).
- The activation function used in between the layers is ReLU.RelU is a popular activation function used to non-linearize the outputs. Most of the audio signals are non-linear in nature, during convolution, this signal has the tendency to become linear. To prevent this, the ReLU activation function is used. Following the 2 convolution layers, the data is passed to a network of 2 dense layers, where the weight and bias of the model get updated and optimized. Adam Optimizer is used to optimize the model and Binary Cross entropy is used as the cost function algorithm. The binary cross-entropy loss function is often used in binary distribution tasks and measures the difference between the predicted class and the actual class. Finally, the model is passed through a sigmoid activation function. The sigmoid activation function helps to bring the output between the range of 0 to 1. The model has 2 outcomes, 'Snoring' and 'Non-Snoring'. During training, a series of spectrogram images and their binary labels (snoring or non-snoring) are fed to the model.
- Using the training data, the model is trained with 10 epochs and the accuracy of the model is evaluated using the validation data. Samples are saved as .wav files and passed to the model for prediction. The model is then exported into Google Sheets for visualization and analysis. The CNN-based snoring detection system is successful in distinguishing snoring from non-snoring. Future research may focus on improving the performance of the system by integrating more features and optimizing the design pattern. performance of the system by integrating more features and optimizing the design pattern.
- Arrhythmia Detection
Arrhythmia is a serious cardiovascular problem that mainly arises in sleep.- This issue affects the normal sleep cycle of a person. Early detection and treatment of Arrhythmia could possibly resolve any future issues related to it. For this, we use the possibilities offered by Convolutional Neural Networks. For the same, we take ECG as the input parameter for the analysis and training.
- The source of the ECGs included is obtained from the MIT-BIH Arrhythmia Database. The dataset obtained is an unbalanced dataset, which will cause underfitting. The input CSV file contains 187 columns and of which 186 are sampled ecg data points and the 187th column is the arrhythmia class. To make the dataset balanced, the data is upsampled which prevents underfitting . There are a total of 87554 data for training.
- N : Non-ecotic beats (normal beat)
- S : Supraventricular ectopic beats
- V : Ventricular ectopic beats
- F : Fusion Beats
- Q : Unknown Beats
.png)
.png)
- The input data, consisting of ECG signals, is a 1D signal with 186 data points, which is the number of samples for each ECG recording. The output of the network is a classification of one of the five arrhythmia types.
- The architecture of the CNN consists of six layers, including three convolutional layers, two max-pooling layers, and two dense layers. The model architecture starts with an input data shape of (186, 1). This indicates that the input data consists of 1-dimensional signals with a length of 186.
Batch normalization is applied after each convolutional layer to normalize the outputs. The resulting feature maps are then subjected to max pooling, reducing the spatial dimensions while preserving important information. The flattened output is passed through two fully connected dense layers with ReLU activation functions. These layers serve as intermediate representations, allowing the model to capture more complex relationships within the data. Finally, the model's output layer utilizes softmax activation to produce probabilistic predictions for each of the five target classes. - During training, the model is compiled with the Adam optimizer and categorical cross-entropy loss function. Additionally, accuracy is used as an evaluation metric. Two callbacks, EarlyStopping and ModelCheckpoint, are implemented to monitor the validation loss and save the best model based on performance. The model is trained on the provided training data, utilizing a defined number of epochs and a specified batch size.
- The first convolutional layer in the model consists of 64 filters, each having a size of 6. These filters slide across the input data, capturing local patterns and features. The output of this layer will have a shape determined by the number of filters, which in this case is (186, 64). Following the first convolutional layer, the second convolutional layer is applied. It also consists of 64 filters but with a smaller size of 3. This layer further refines the learned features by convolving the filters over the previous layer's output. The resulting output shape will remain (186, 64). The third and final convolutional layer in the model also has 64 filters, with the same size of 3 as the previous layer.
- Each convolutional layer has 64 filters with a kernel size of 6 for the first layer and 3 for the remaining layers. The two dense layers have 64 and 32 units, respectively, and use the ReLU activation function. The output layer has 5 units with the softmax activation function for the classification. The model is compiled using the Adam optimizer and categorical cross-entropy loss function. During training, the validation set is used to monitor the training process. The model uses early stopping and model checkpointing to prevent overfitting. The entire process is shown in Fig. 3.10.The training is performed with a batch size of 32 for 10 epochs. The function "network" takes as input the training and testing data and returns the trained model and the training history, which can be used to evaluate the performance of the network.
- For Real-time analysis, the system will grab live data from a Google sheet posted by AD8232 ECG Sensor. The model waits for the 186 sample points to predict the output class. The predicted class of Arrhythmia is posted into Google Sheets which is indeed retrieved by mobile application API and is provided to the user.
- The architecture of the CNN consists of six layers, including three convolutional layers, two max-pooling layers, and two dense layers. The model architecture starts with an input data shape of (186, 1). This indicates that the input data consists of 1-dimensional signals with a length of 186.
- Bio-med Data Acquisition
.jpg)
- The sensor values of MAX30102, MPU6050, and AD8232 are acquired through ESP8266. MAX30102 uses infrared light to measure oxygen levels in the blood. It uses the I2C interface while connecting to ESP8266. Once it is connected with the "MAX30105.h" and "HeartRate.h" library, gives the red and infrared light levels.MPU6050, a motion and orientation sensor needs to be connected with ESP8266's I2C interface and use an "AdafruitSensor.h", "AdafruitMPU6050.h" and "MPU6050.h" library to interface with the sensor. When connected gives the values of the accelerometer and gyroscope like the X, Y, and Z axis values.
- AD8232, a heart rate monitor measuring the electrical activity of the heart needs to be connected to the analog input of ESP8266. Gives the raw analog signal from the sensor.
- For the sensors to connect to Google Sheets, ESP8266's built-in Wi-Fi capabilities are used to connect to the internet and communicate with Google Sheets. Google Sheets is made ready for this by changing the Google script code to be able to receive the values from ESP8266. For this Google sheet ID is made to change according to the sensor values incoming through ESP8266 using Wi-Fi.
Room Data Acquisitio.jpg)
The methodology adopted by this project is to gather sensor data via an acquisition controller, which will then be utilized as input parameters for a machine learning model deployed.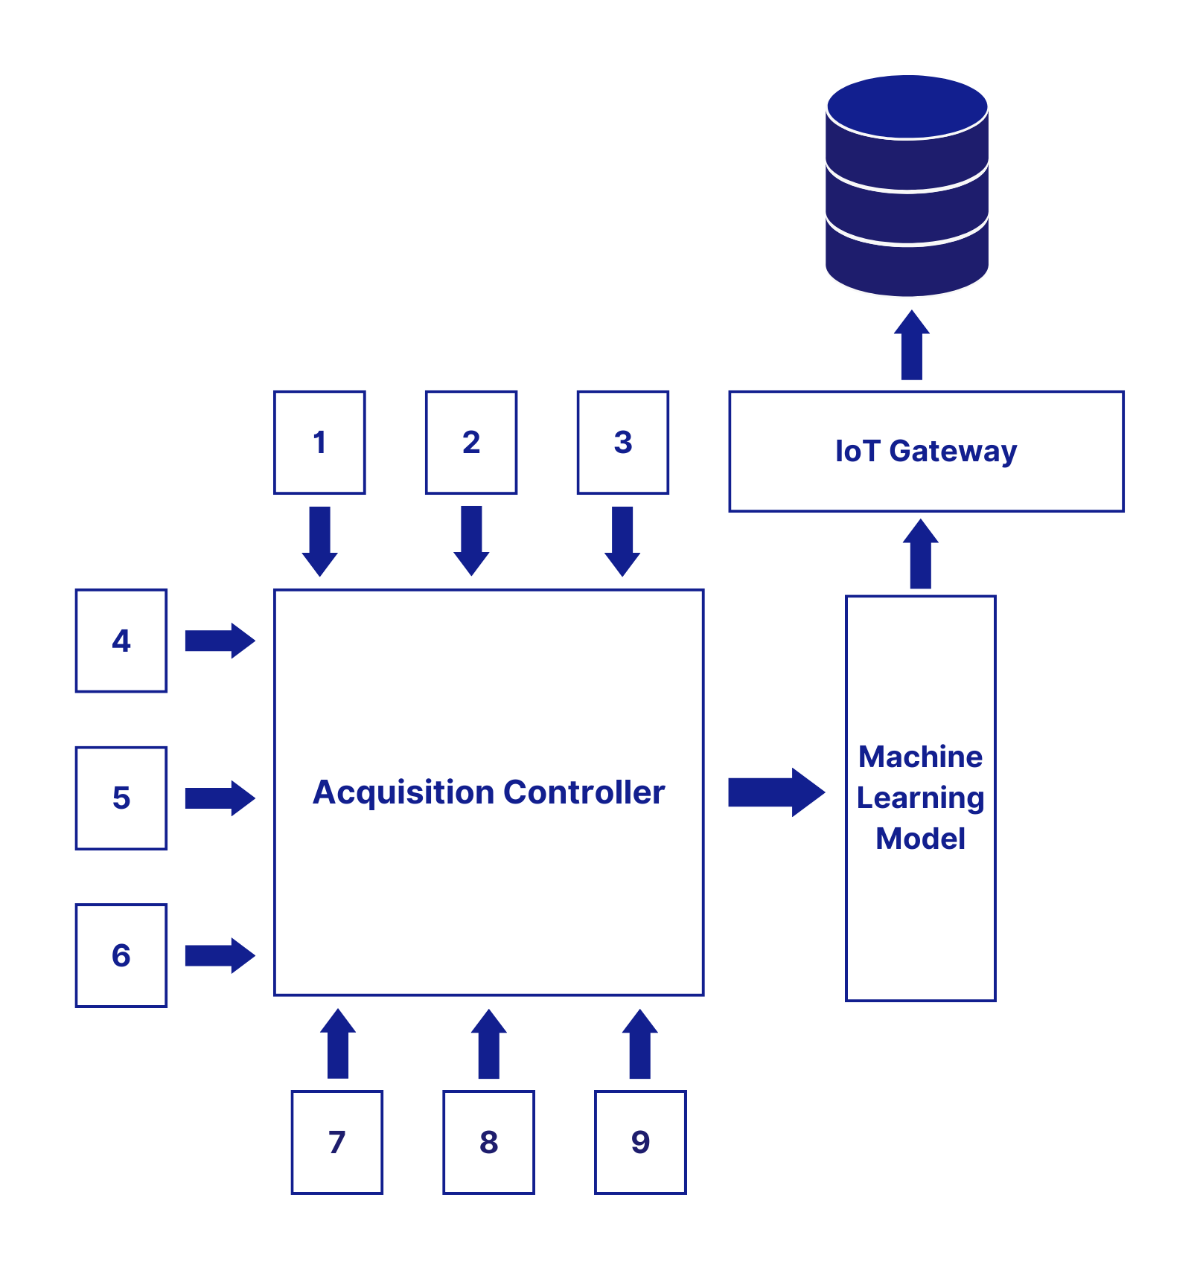
1- Humidity
2- Temperature
3- Ambient Light
4- Light Intensity
5- Atmospheric Pressure
6- Altitude
7- AQI
8- Room Dimensions
9- No of occupants
10-Air Velocity
Humidity, ambient light, light intensity, atmospheric pressure, altitude, AQI, room dimensions, number of occupants, and air velocity can all impact the sleep cycle of an individual.
The IoT gateway enables the system to upload the collected sensor data to a server for further analysis. The hardware system is divided into an acquisition controller and an IoT gateway. The Arduino Nano is chosen as the acquisition controller and Raspberry Pi as its IoT gateway. The sensors are deployed to collect the data and send it to the acquisition controller, which receives and does necessary computations and packs all these data in the form of a string. The string is passed on
to Raspberry Pi through USB protocol. The machine learning model is deployed in Raspberry Pi, which unpacks this data and uses it as the predictive model’s input parameters. Input parameters for the model include ambient light, light intensity, Air Quality Index, Altitude, Barometric pressure, Room dimensions, humidity, and temperature. The data transmission between the cloud and raspberry pi has been adjusted so that it does not exceed the free message limit offered by Google API.
For experimentation purposes, the values for the inputs were generated by identifying a mean value for each parameter from the resources available on the internet. Later with this mean value, a Gaussian distribution is modeled, with appropriate standard deviation, which is used to produce 10,000 dataset values for training, therefore we could use this distribution to obtain a graph that would be dominated by values closer to the mean. 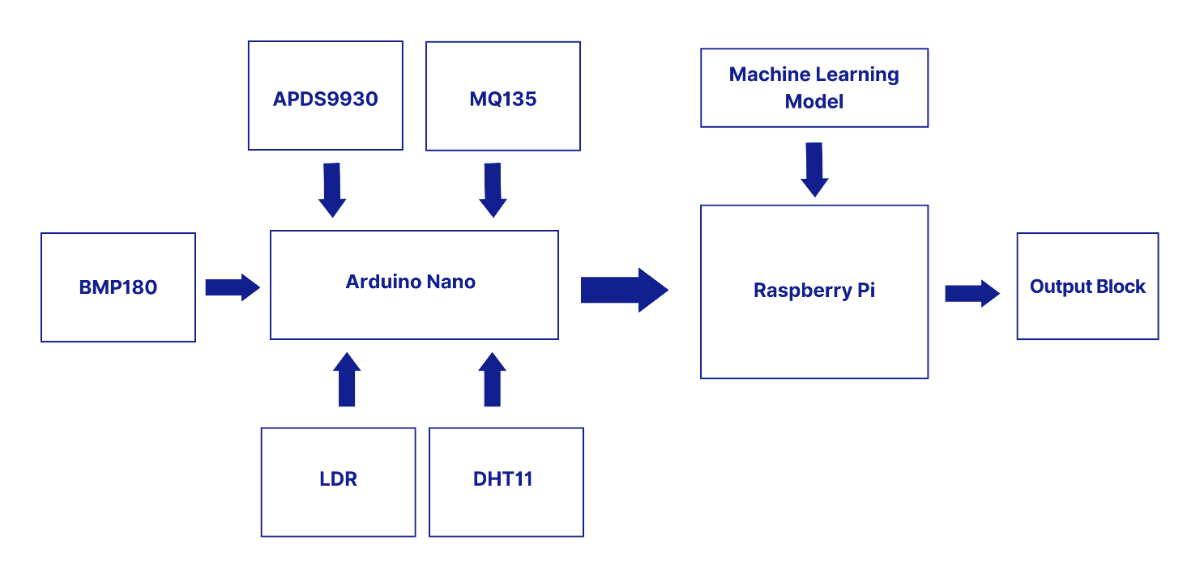
- Sleep Stage Classification
The sensor values from the room data acquisition controller and Bio-Medical Acquisition controller are posted into a Google sheet. These Data are being used to predict the sleep stages using Multiple Linear regression. For experimentation and research, the dummy dataset for these is mapped to corresponding sleep stages.- Polysomnography will be used to gather the exact dataset as its future follow-up, which will result in reliable and precise sleep stage classification. The algorithm used here for
prediction is Multiple Linear Regression(MLR).MLR is a statistical method that inputs multiple explanatory parameters to predict the outcome of a variable. The following model is a multiple linear regression model with k predictor variables, x_1, . . . , x_k.
- Polysomnography will be used to gather the exact dataset as its future follow-up, which will result in reliable and precise sleep stage classification. The algorithm used here for
The system will be capable to predict outcomes such as Rapid Eye Movement(REM), Non-Rapid Eye Movement(N-REM), Deep Sleep, and Awake. The code reads the dataset in the form of a CSV file located in Google Drive. The file contains data related to various features such as humidity, temperature, air quality index (AQI), electrocardiogram (ECG), etc., and a target variable named "Stages". The code then splits the data into training and testing sets .following that, it creates a linear regression model using the LinearRegression class from the sci-kit-learn library and fits the model to the entire data using the fit() method.
- Ambient Light Variation of LED using ESP8266 and RTC Module
The methodology involves implementing a system that controls the variation of an LED's brightness based on the user's input time. The hardware setup includes connecting the ESP8266 and the RTC DS3231 module according to the circuit diagram, ensuring secure and proper connections. The software setup involves installing the necessary libraries for the ESP8266, RTC DS3231, and any additional dependencies, along with configuring the Arduino IDE to work with the ESP8266 board.the RTC module is initialized using the Wire library to establish communication between the ESP8266 and the RTC module through the appropriate SDA and SCL pins. The connection with the RTC module is verified to ensure its presence. If the module is not detected, an error message is displayed, and the program execution is halted. Next, the ESP8266 is configured to connect to a Wi-Fi network by providing the SSID (network name) and password. The necessary logic is implemented to establish a connection, and once successful, a message is displayed indicating the successful connection to the network.User input is obtained by prompting the user to enter the desired time through the serial monitor in the format of HH:MM AM/PM. The user input is read and parsed to extract the hour, minute, and AM/PM information, which are stored in variables for further processing. The RTC module time is then adjusted using the parsed user input values. The year, month, day, hour, minute, and second values are set in the RTC module to synchronize it with the desired time. The successful setting of the RTC module time is verified. Continuously monitoring the current time from the RTC module, the time difference between the current time and the user input time is calculated. Conditional statements are implemented to control the LED behavior based on the time difference. If the time difference is within a specific range, such as 5 seconds before and after the user input time, the LED brightness is adjusted to a predefined dimmed level. If the time difference exceeds the predefined range, the LED is turned off.The system operates within a loop structure to continuously monitor the time and control the LED behavior accordingly. The loop runs indefinitely, ensuring continuous monitoring and adjustment of the LED based on the time. The functionality of the system is tested by entering different user input times and observing the LED behavior. The code and parameters, such as the LED dimming duration and brightness level, are fine-tuned to achieve the desired lighting effects and behavior. Code optimization is performed to enhance efficiency by minimizing unnecessary delays or processing steps. Finally, the LED control functionality is integrated with the overall sleep analysis and quality tracking system. Proper communication and synchronization between the LED control module, sleep analysis algorithms, and other system components are ensured. Integration testing is conducted to verify the seamless operation of the entire system.
- Flutter App Development
Flutter is a free and open-source platform utilized by many Android developers across the world. It was created by Google and enables programmers to produce stunning and responsive web and desktop applications for iOS and Android devices. Developers can easily create stunning interactions and animations with Flutter's broad collection of customizable widgets and reactive programming style. Hot-reloading is the best option for teams that want to swiftly develop and distribute high-quality mobile apps since it enables rapid iteration and development. In addition to having a large widget library and excellent functionality, Flutter also offers several other advantages that make it a popular platform for creating mobile apps. For instance, because it employs a compiled language (Dart) rather than relying on an interpreter, its performance is frequently lauded for being quick and effective. Flutter also comes with a tonne of testing and debugging tools, which makes it simple for developers to locate and address errors early in the development cycle. Additionally, Flutter has a sizable development and fan community as well as a wealth of online learning and support tools.
- Flutter widgets
Flutter widgets serve as the foundation of a Flutter application. These are required before developing UI elements like buttons, text, and images that may be merged and altered to create the ideal UI design for your project. Flutter widgets are either stateful or stateless, which means they either store and preserve their internal state or keep the output static. One of Flutter widgets' key advantages is that they are simple and reusable. Developers can update current widgets or design their own, which can be used across numerous displays and even shared between projects. Furthermore, because Flutter employs a reactive paradigm, widgets can be modified in real-time in reaction to user input or data changes. This allows for the creation of an outstanding and practical user interface that appears smooth and fluid even on low-end devices. In Flutter, widgets are represented as a hierarchical tree structure. The widget tree depicts a Flutter app's whole UI, with each widget representing a specific aspect of the UI. A widget button, for example, can be placed inside a widget box inside a column or row widget to create a more sophisticated layout. Flutter widgets are highly customizable, with components such as color, text size, and padding, as well as advanced techniques like as animations and transitions, allowing them to be developed.
Furthermore, Flutter contains a plethora of pre-built widgets, such as Design Kits and Cupertino-style tools, that can be utilized right away to create a beautiful and consistent user interface. Overall, Flutter widgets are an effective tool for developing aesthetically beautiful and interactive mobile applications. Functional templates make it simple to design dynamic and responsive interfaces, while UI components may be quickly created and modified by developers.
- Integrating Google Sheet With Flutter
Google Sheets is a well-known cloud-based spreadsheet application that allows users to save, manage, and analyze data. Many developers include Google Sheets in their applications to take advantage of its extensive collection of features and capabilities. In this article, we will look at how to use the Google Sheets API and the Google APIs Client Library for Dart to integrate Google Sheets into a Flutter application.
We began by creating a new project in the Google Cloud Platform (GCP) Console and enabling the Google Sheets API for that project to incorporate Google Sheets into a Flutter application. This provided us with access to the Google Sheets API endpoints that we required with the Google Sheets service. We next created a new OAuth 2.0 client ID in the GCP Console to produce a set of credentials for our application. With these credentials, our Flutter app was able to authenticate with the Google Sheets API and access our Google Sheets data.
The Google APIs Client Library for Dart was then added to our Flutter project via the package manager. This library supplied us with a set of classes and methods that made working with the Google Sheets API easier. These classes and methods were used to create new spreadsheets, read data from existing spreadsheets, and change data in specific cell ranges.
We were able to construct robust applications that allowed users to access and alter data contained in Google Sheets straight from their smartphones by integrating Google Sheets into our Flutter application. We were able to use the spreadsheets. values. get method to retrieve data from a Google Sheets spreadsheet and the spreadsheets. values.update method to update data in a specific region of cells. The API client also included methods for generating new spreadsheets, removing old spreadsheets, and performing other operations.
The flexibility to share data across numerous users or devices was one of the primary benefits of using Google Sheets in our Flutter application. We were able to effortlessly work with others and share data in real-time using Google Sheets. This was especially useful for applications requiring complex data management operations or synchronizing data across several devices.
Integrating Google Sheets into a Flutter app can be a great method to manage and control cloud data. Developers may create powerful and robust applications that let users access and alter data contained in Google Sheets directly from their devices by leveraging the Google Sheets API and the Google APIs Client Library for Dart. Google Sheets, with its extensive collection of features and capabilities, is an ideal choice for developers wishing to create data-driven applications that provide a superior user experience.
- Google APIs Client Library for Dart
The Google APIs Client Library for Dart is a library that allows Dart applications, especially Flutter apps, to easily access Google APIs. It enables developers to utilize Dart code to interface with a variety of Google services, including Google Drive, Google Sheets, and Google Calendar.The library includes methods for authentication, authorization, and processing API requests and answers, as well as a simple and uniform interface for accessing Google APIs. It also provides rate restriction and batching tools to help optimize performance and reduce the amount of API queries.
Based on the Google APIs Client Library for Java, the Google APIs Client Library for Dart is intended to be simple to use and lightweight, with a small code footprint and few external dependencies. It is available as a package in the pub. dev, the official Dart and Flutter package repository, and can be installed via the pub package manager.
- Sleep Tracking app
The Flutter-powered smartphone app contains a slew of novel features that allow users to measure their sleep and optimize their sleeping environment. The most noticeable feature is the daily sleep score, which assesses the quality of a user's sleep based on numerous parameters such as duration, depth, and any nighttime disruptions. 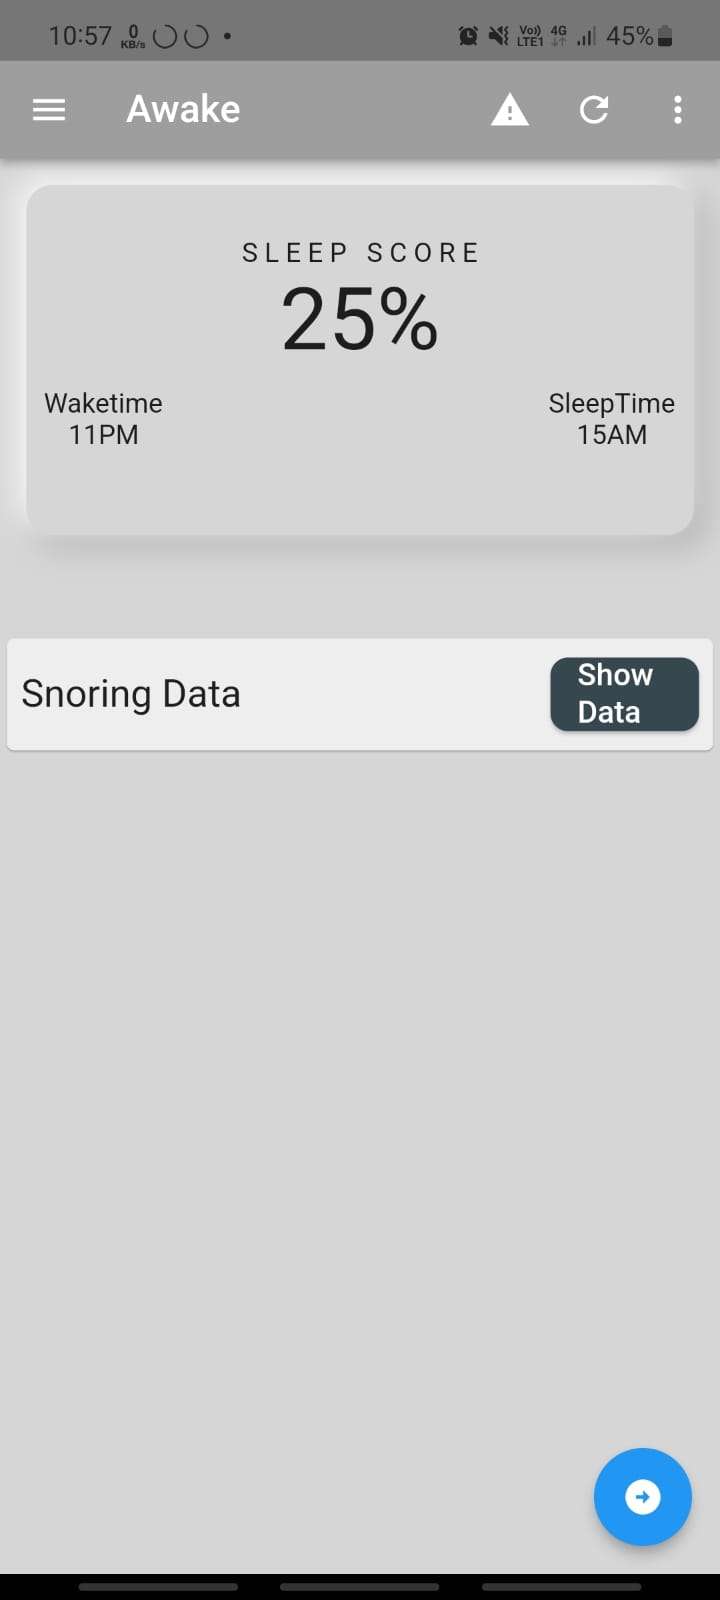
Furthermore, the app provides insights into sleep patterns, allowing users to create goals for healthier sleeping habits. It also captures snoring data, which might signal potential health issues and provide extra sleep quality information.The application can provide insights into arrhythmia detection to identify irregular cardiac rhythms while sleeping, which can aid those with heart issues. The app also has smart room control, which allows users to adjust the temperature, lighting, and other aspects of their sleeping environment to improve their sleep.
Finally, the application provides sleep and wake time-based room automation, ensuring that users have an optimized sleeping environment according to their preferences. In conclusion, these characteristics combine to offer the app a highly personalized tool for enhancing sleep quality and overall well-being.