
INTRODUCTION
This project came about from my experience working as an industrial maintenance engineer for over 7 years. Technologies like the Internet of Things (IoT), low-power embedded systems, and artificial intelligence have created significant opportunities in the field of maintenance, known as Predictive Maintenance.
The current project combines these technologies into a single device designed to monitor the health of rotating machines by analyzing vibration spectra.
The key features of the device are:
- Battery-powered: It runs on a 3.6V battery, so it doesn't need any external power sources or cables.
- Ultra-low power consumption: The device uses very little power by hibernating and waking up through programmable events, which extends battery life for months or even years.
- Edge computing: It processes recognition algorithms internally using neural networks to detect specific faults or anomaly detection behavior.
- IoT capabilities: This device, or "node," can send the neural network's results to a gateway, which connects to the internet via Ethernet or Wi-Fi.
- Gateway: This is based on a Raspberry Pi microcomputer that runs an algorithm to receive information from the node, process it, and send it to the cloud using the MQTT protocol.
- Dashboard: I designed a cloud-based dashboard using Ubidots, which is on a free plan that helps me verify and demonstrate my project.
The software used includes Arduino, Python, and C++. The hardware includes a Raspberry Pi 4, an ESP32, and an ADXL355 evaluation board, Nordic power profiler.
Project
Let's get started:
To kick off my project, I first needed to select my hardware, which had to meet the following requirements: low power consumption, efficiency, support for both wireless and serial communication protocols, and the ability to process and store data.
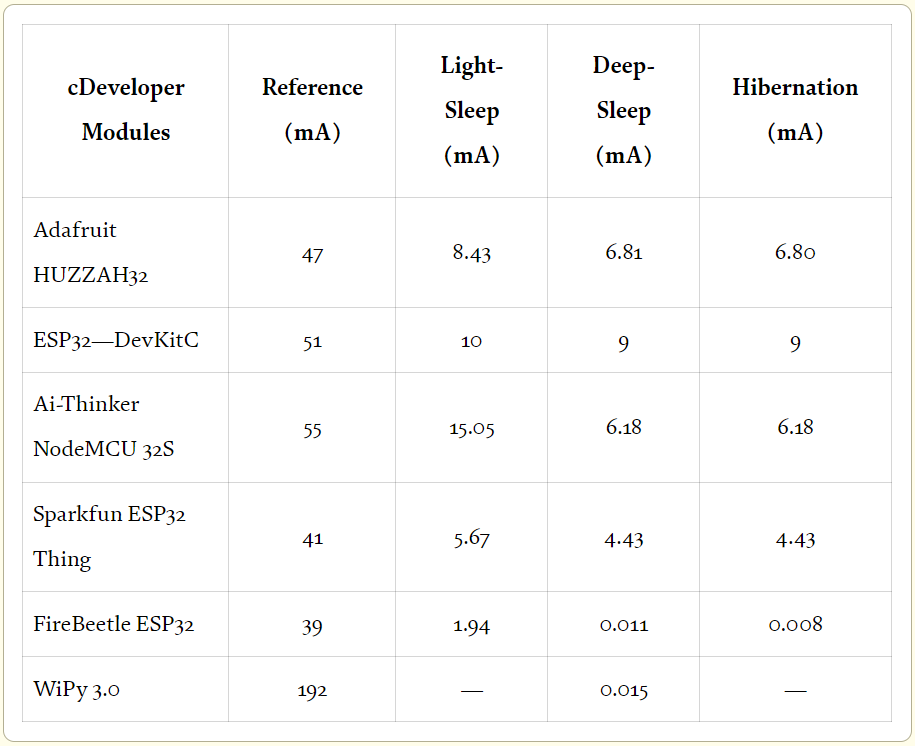
For my needs, the firebeetle ESP32 from DFRobot was an excellent choice. It meets all my requirements, is cost-effective, and is widely used by the community, offering great support and documentation.
This development board is known for its efficient design and has one of the lowest power consumptions on the market (compared to other ESP32 development boards).
I will also include the schematic diagram of the development board. $$$$$SCHEMATIC DIAGRAM$$$$$$$$$$$$
Journal: IoT on an ESP32: Optimization Methods Regarding Battery Life and Write Speed to an SD-Card | WRITTEN BY: Lukas M. Broell, Christian Hanshans and Dominik Kimmerle.
The FireBeetle ESP32, as our embedded system, can operate in energy-saving modes such as light sleep and deep sleep, both of which are very interesting for our application.
To power our development board, we selected the Tadiran 3.6V lithium battery, size AA, model 33-TL2100. This battery has important characteristics such as it's electrical capacity, size, and operating temperature range. The manufacturer also provides a discharge capacity graph, which is extremely important for monitoring the battery level of the device.
Characteristics:
- Voltage: 3.6 volts
- Size: AA
- Capacity: Approximately 2200 mAh
- Chemistry: Lithium Thionyl Chloride (Li-SOCl2)
- Operating Temperature Range: -55°C to +85°C
- Shelf Life: Up to 10 years (depending on storage conditions)
- Energy Density: High energy density, providing long-lasting power
- Self-Discharge Rate: Extremely low, less than 1% per year at 20°C
.png)
"MEMS" SENSOR
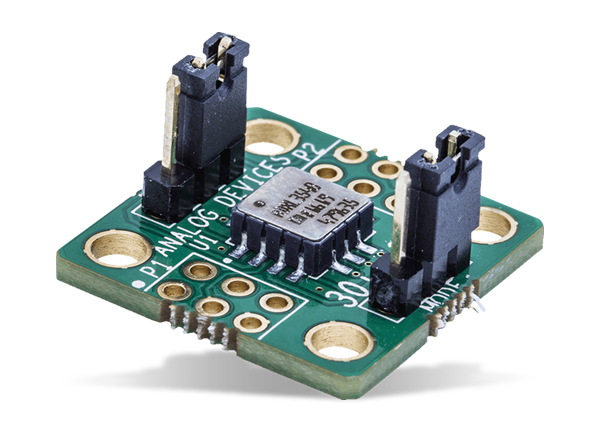
To measure the vibration of motors and rotating machines, we selected an ultra-small and compact development board from Analog Devices, the EVAL BOARD ADXL355Z. This high-precision, low-noise 3-axis accelerometer can measure a wide bandwidth, up to 1 kHz, and is programmable using the I2C protocol. Other characteristics that make it suitable include its low operating consumption, wide power range, deep sleep modes, and interrupt capabilities. The technical data sheet specifies that some of its applications are:
- Seismic imaging
- Robotics
- Condition monitoring
The last application is of great interest to us. I've included the wiring diagram for the sensor. $$$$$add schematic$
Now that we've chosen our hardware, our next step is to develop an algorithm. This algorithm will form the foundation for building the program that our development kit will run, piece by piece.
The main idea behind the algorithm is to break down the project into smaller more manageable tasks that are easier to tackle.
The key building blocks include:
- A function to enable low-power modes like light sleep and deep sleep.
- Setting up I2C communication with the ADXL355 development board.
- Implementing wireless communication using the ESPNOW protocol.
- Selecting the type of interruption to wake up from light sleep or deep sleep modes.
- Creating a buffer to store acceleration data.
- Processing the data buffer using a neural network algorithm.
- Design of a gateway device
- Dashboard design in the cloud (easier than it seems)
Some of these blocks might seem complex right now, but as we move forward with the project, we'll explain each one in detail.
So, at first glance, the diagram for the first half of the project would look like this. That's clear; as you can see, this is the design of the TinyML sensor.
.png)
To accelerate our design, we used the Arduino IDE, a tool that helps us develop our proof of concept very quickly.
We will start by developing the functions for each of the aforementioned blocks. Once these functions are ready, we will develop the algorithm to make these functions interact with each other (I don't want to extend the project too much). The complete software is included in the code annex.
The final algorithm can give a better idea of how the different functions interact. and gives a better understanding of the internal blocks handled by the tinyML sensor
.png)
The most interesting part might be the neural network processing block of the algorithm. To build this algorithm, there are various techniques and libraries available. Since this project serves as a mockup or proof of concept prototype, I utilized a powerful tool provided by the AI development company in embedded systems, Edge Impulse.
Edge Impulse is a platform that helps developers create, train, and deploy AI models directly on small, embedded devices like microcontrollers and sensors. It lets you leverage machine learning right on these devices themselves, where the data is gathered, without needing cloud connections for processing.
Here's a rundown of the steps to implement your AI algorithm using Edge Impulse:
Create Project: Log in to Edge Impulse and start a new project.
Data Collection: Gather data from your sensors or devices and upload it to your Edge Impulse project.
Data Labeling: Label the data to specify the different classes or categories your model will identify.
Model Training: Use Edge Impulse tools to train your machine learning model with the labeled data.
Validation and Optimization: Check how well your model performs and adjust settings to enhance accuracy and efficiency.
Library Generation: Once satisfied with the model, generate a library tailored to your chosen hardware platform within Edge Impulse.
Integration and Deployment: Integrate the generated library into your hardware project and deploy it onto your device. This enables your device to make real-time predictions.
.png)
For data collection, I decided to set up a test bench using a 3/4HP single-phase motor. The main goal was to gather a comprehensive database of acceleration using my adxl355 sensor. I then formatted this data into CSV and added it to the EDGE IMPULSE workflow.
My main aim is to develop an AI that can identify four different engine states based on acceleration data:
- Normal engine operation (indicating good health).
- Engine turned off.
- Engine with an unbalanced load (suggesting poor health).
- Engine showing abnormal operation (indicating an unhealthy state).
To simulate these conditions, I deliberately created unbalanced and abnormal states by unevenly loading the motor, adding more weight to one end.
I've attached photos of my test bench setup and how I connected my load and smart sensor.
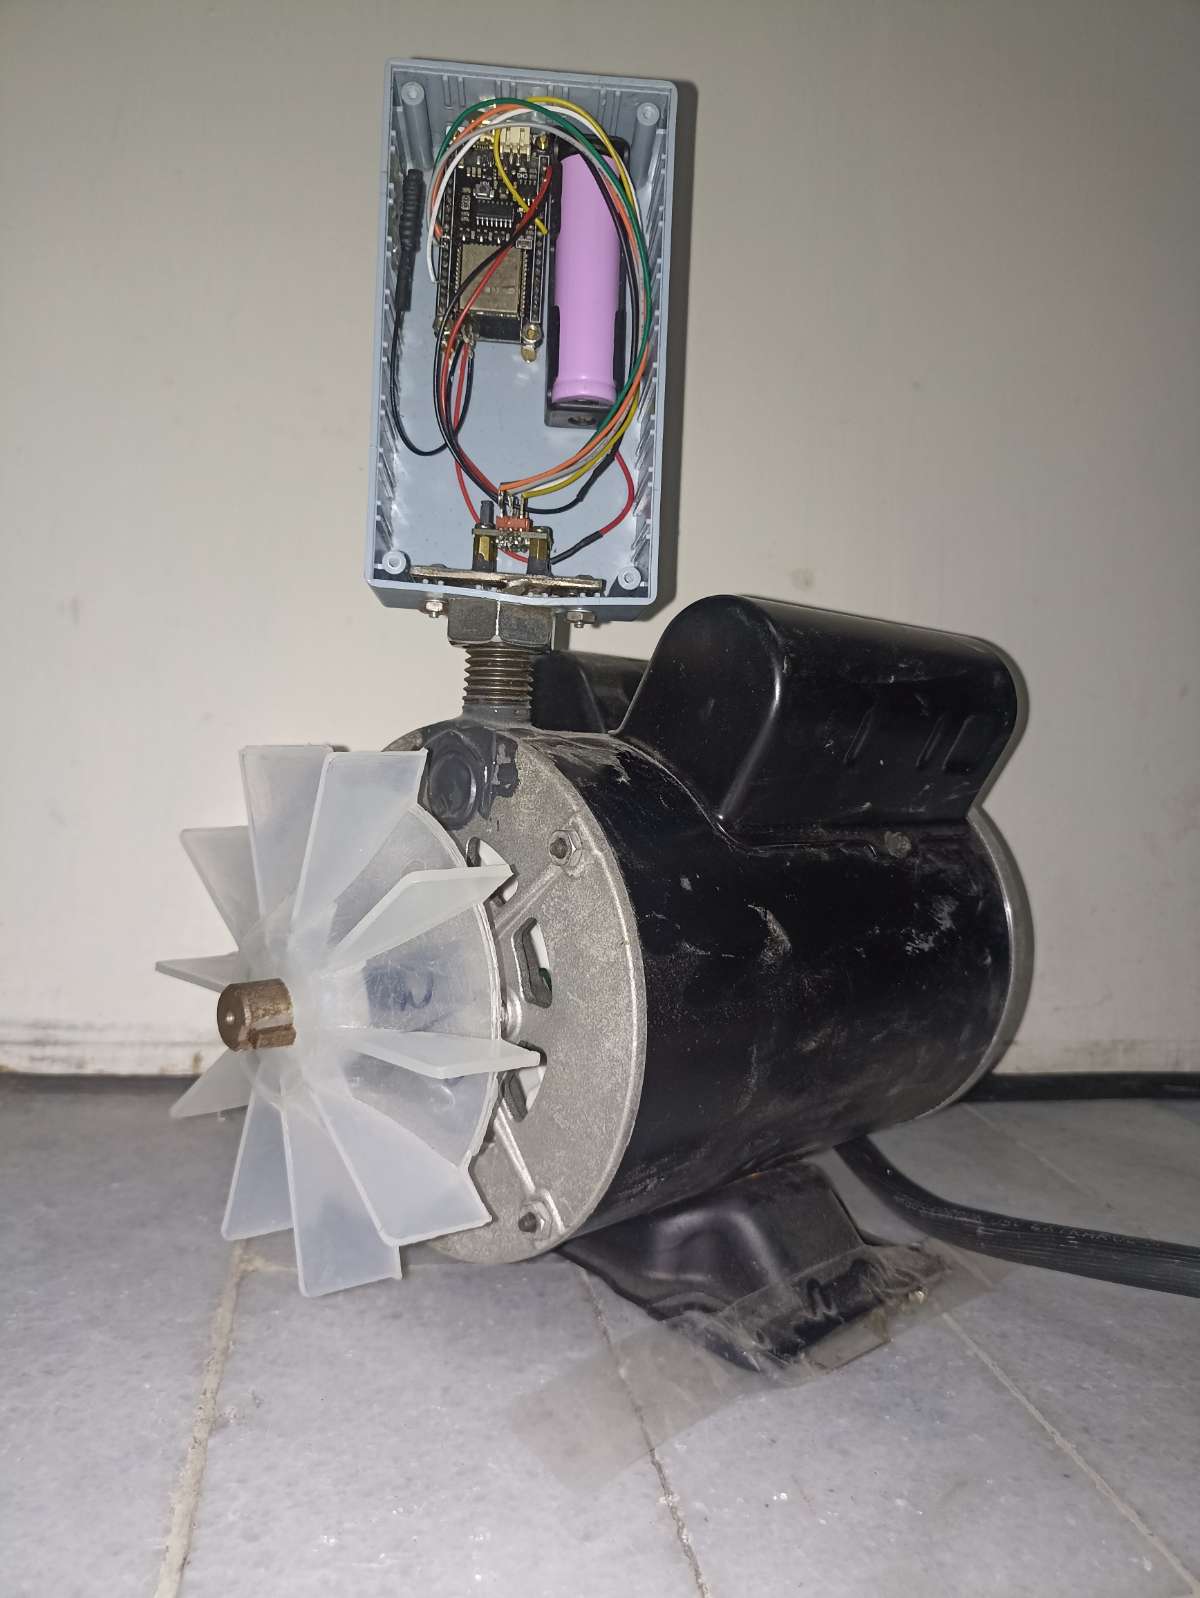
As you can see, my smart sensor setup includes an ESP32, an ADXL355 evaluation board, a battery, and an antenna, all housed inside a box. I've also mounted it on a steel base to connect it securely to my AC motor.
It's crucial to install the sensor properly on the engine to avoid excessive vibration, which could overwhelm the accelerometer's sensitive output. The ADXL355 is notably more precise than its smaller counterparts, so ensuring stable installation is key.
.jpg)
A super important part of my project is to ensure a long life for the battery-powered smart sensor, which is why it is necessary to use an energy consumption graph to monitor the behavior of my embedded system. What I chose was the NORDIC product called Power Profiler which I highly recommend for its precision features and real-time functions which are very useful when working with low-power systems.
Below I present the first image which represents the current consumption graph of the smart sensor from start to finish. What do I mean by start to finish, I mean the complete process in which the sensor is in deep sleep, awake, executes all its tasks and then goes into deep sleep mode again until the condition that will wake up the embedded system again is met.
This is a real current graph of my smart sensor:
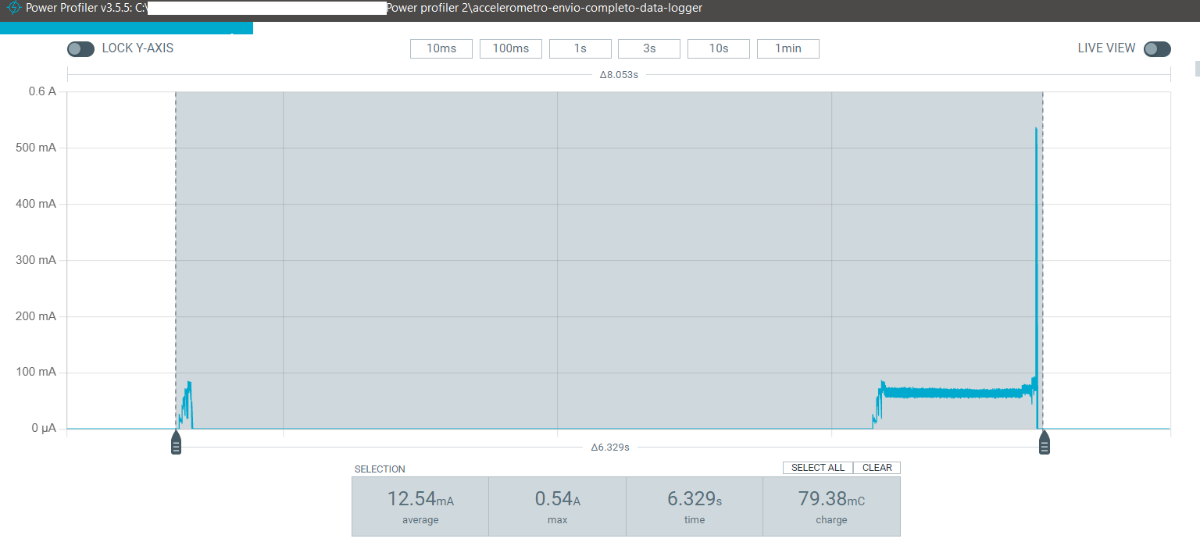
power profiler graphs in blue the current consumed by my embedded system. As I mentioned before, this is the behavior of my smart sensor from the moment it wakes up until it goes back into deep sleep mode. It is essential that my embedded system does not have downtime when being in active mode since this would directly impact the battery life, so if any waiting period or time delay is needed, it must be done by setting the Intelligent sensor in deep sleep mode.
In my case, the average current consumption each time the smart sensor acquires the accelerometer data, applies AI algorithms and sends a result via espnow is 12.54 mA as the average consumption for a time period of 6 seconds. On the other hand, the maximum or peak consumption can reach approximately 540 mA, this for a very short time. Can you guess which internal block of the ESP32 causes this current consumption?
preliminar video:
Now I will explain the behavior of the graph
Initially, the embedded system is in low consumption or sleeping mode. The ADXL355 accelerometer sensor has a pin which was programmed to send a signal to the embedded system and wake it up as soon as the ADXL355 sensor detects changes in the acceleration values in its x, y, z axes.
Thus, once the sensor wakes up the embedded system, it changes to active mode and begins the first part of its tasks, which consist of setting certain internal blocks.
Once this is finished, it will go to sleep again for approximately 5 seconds.
This time of 5 seconds is what I need in my experiments for the motor to start normally, it is simply a delay that I give to avoid confusing readings from my accelerometer sensor.
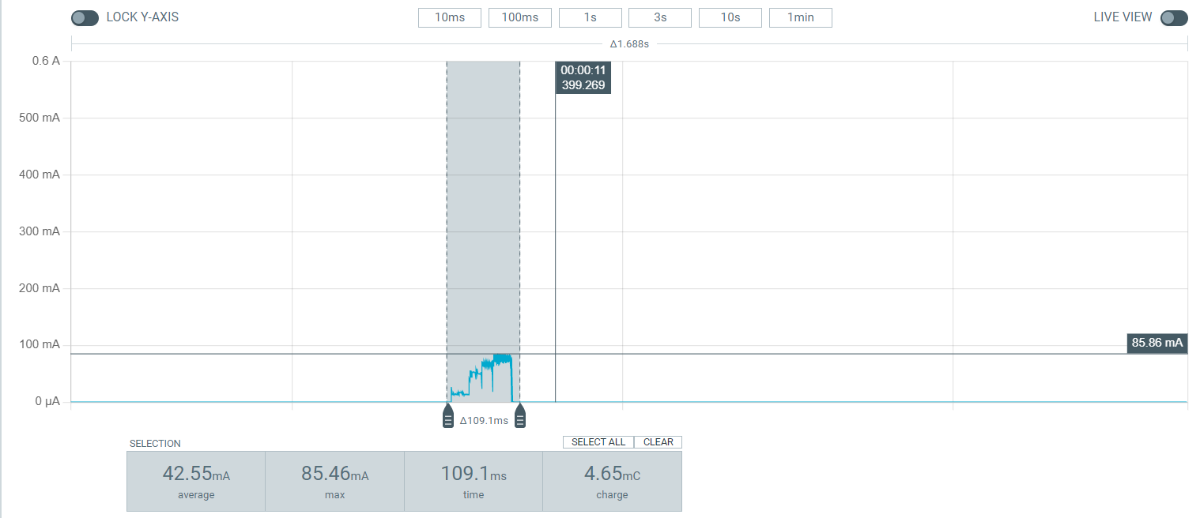
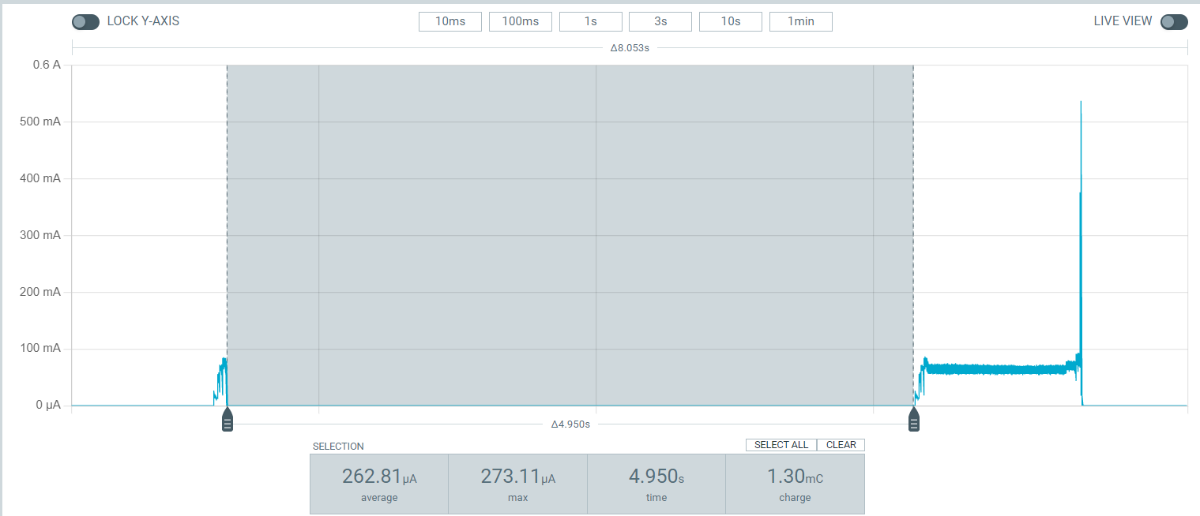
As I said previously, in these 5 seconds the embedded system is in deep sleep mode, so battery consumption is minimal, 260 uA average.
At the end of the 5 second wait, the embedded system wakes up and changes to the active state, and this is where most of the resources are taken. We begin with the acquisition of the acceleration values and then store them in a buffer, later the buffer which is found as a function of time, goes through FFT algorithms to obtain the spectrum of the signals of the X, Y, and Z axes.
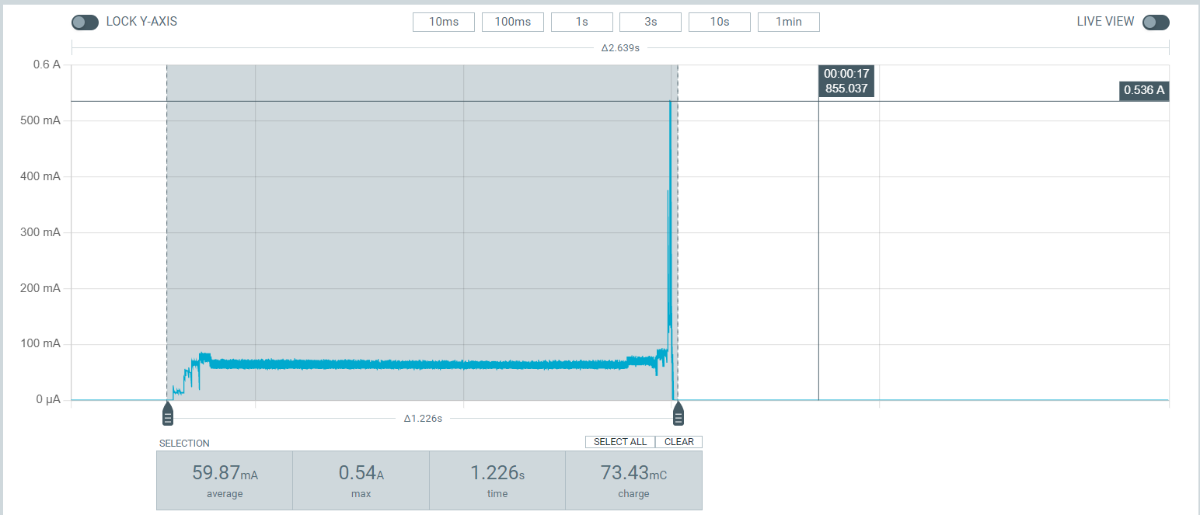
The next step is to feed the neural network algorithm with the spectrum of the signals. Afterwards the neural network algorithm is executed and the result that obtains the greatest weight will be packaged in a data packet that will be sent through the espnow protocol, but in order to To send this information packet, it is necessary to activate the ESP32 Wi-Fi block. This RF module is the one that generates quite high consumption, although for a very short period of time. Once activated, the data is sent through the Espnow protocol. It is precisely in this part of the process where we see the consumption of 536 mA.
Once the data has been sent successfully, the embedded system configures certain control blocks and goes into deep sleep mode to save battery, until the conditions that wake it up are met and it starts the cycle again.
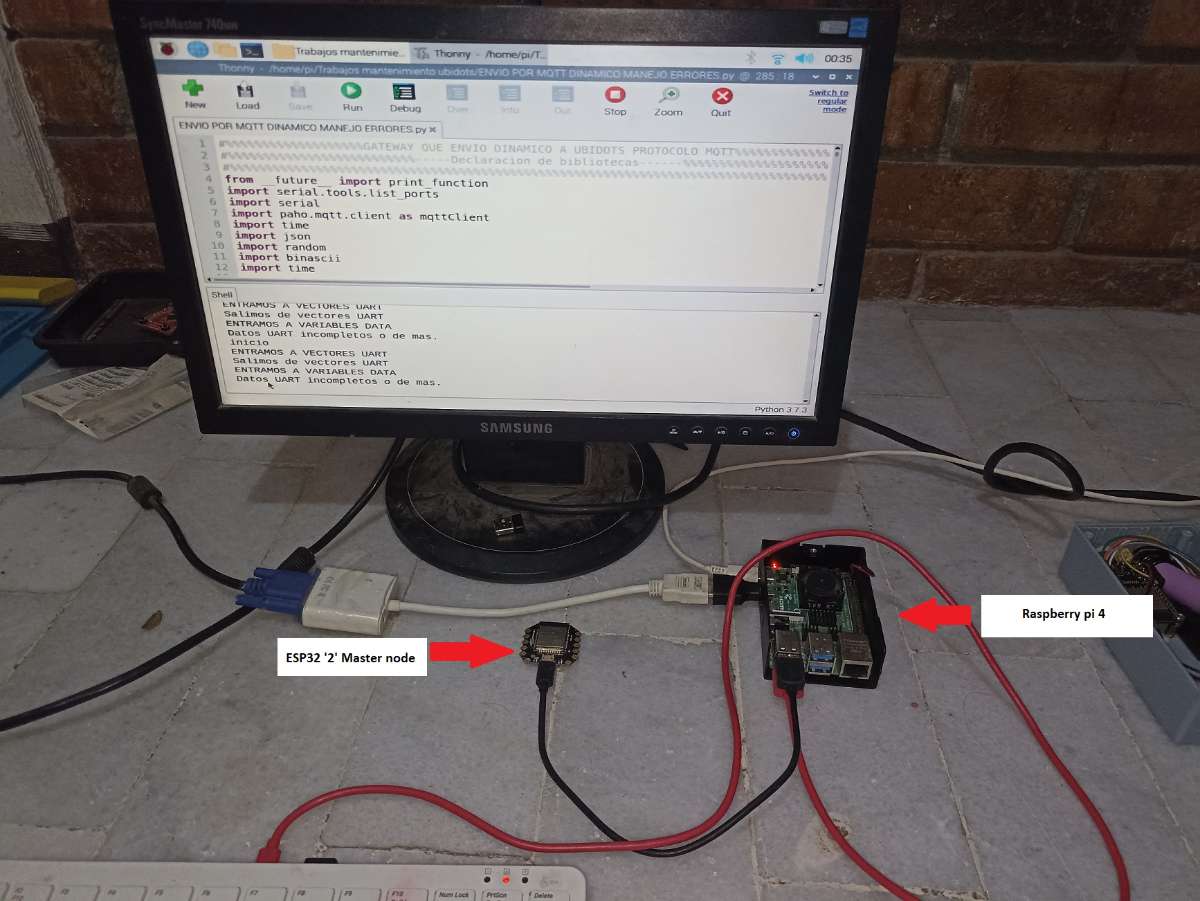
The second part of my project involves designing the gateway. For this, I'm using another ESP32, mainly because the smart sensor already uses the built-in ESP-NOW protocol from Espressif.
Once ESP32 '2' receives the packet with data from the smart sensor, it sends an acknowledgment bit to confirm successful transmission between both ESP32 modules.
Subsequently, the ESP32 ´2´ unpacks the espnow data packet and, using a UART-USB protocol, sends all the information to a Raspberry Pi. The communication between the esp32 '2' and the raspberry pi has redundancy checking error algorithms to ensure that the information sent is secure and reliable. Finally, the raspberry pi is processing a python program which has tasks such as establishing communication between the esp32 and the raspberry pi, storing the information received, packaging it and sending it to the ubidots cloud using the MQTT protocol.
UBIDOTS displays this data in a dashboard that I designed myself. UBIDOTS offers an intuitive and easy-to-use interface, but you have to add the creativity!
This is a real image of what my dashboard looks like.
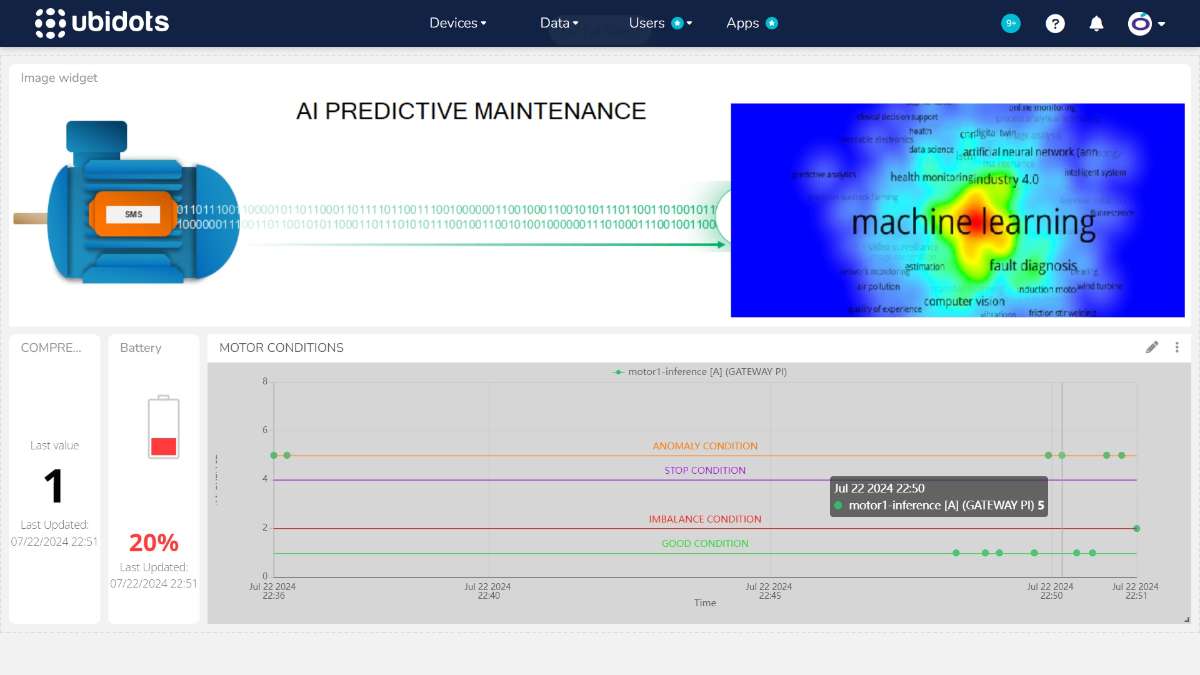
As you can see, in the dashboard we have an indicator block that tells us the ID of the sensor, we also have an indicator of the real battery of the device, and finally a graph in which we have 5 behavior states (good condition, imbalance condition, stoppage and abnormal condition) which help us know the health status of the induction motor.
Finally I attach a video of the project.
Smart sensor test under an balance load
Smart sensor test under a unbalance load.
My future plans include four main goals:
- Expand sensor recognition capabilities. Possibly recognize 10 main faults in electric motors.
- Migrate to an accelerometer with much greater capacity to measure high frequencies of up to 15 kHz, suitable for applying spectral predictive analysis.
- Improve sensor autonomy by reducing it's consumption.
- create syntetic data to develop the sensor trainning.
Here are some links that were very helpful for my project:
- Github - Collection of data collection examples that store raw data samples as comma-separated values (CSV) files to be uploaded to Edge Impulse.
- Espressif ESP-NOW Protocol - Information about the ESP-NOW protocol used for communication between ESP32 devices.
- Nordic Power Profiler - Essential tool for measuring power consumption in low-power devices.
- UBIDOTS - For creating and managing IoT dashboards. my dashboard https://stem.ubidots.com/app/dashboards/615fcb39ff50f61248f71107
These resources were instrumental in developing and refining my project.