Introduction
![]()
GPS Tracking
GPS tracking is used in many applications for fleet management, location tracking, etc. It has a wide range of applications. One of the most popular applications, and one that you will be familiar with is tracking of vehicles in real time (used in taxi service apps such as that of UBER).
In the application that we will be creating, we will be using a nodeMCU that will be interfaced with a GPS receiver. The nodeMCU will send latitude and longitude data received from the GPS receiver to an Azure IoT Hub. The hub will relay this data through a Stream Analytics Job to the Power BI used as a sink for this data. We will map this data on a map on the Power BI site so that we can track the data.
For this application, we will need the following :
1. A NodeMCU which can send data to an IoT Hub.
The code for the NodeMCU device is available in Source Code section at the end of this page.
Details about the code and how to set up the device are covered below in the later sections.
2. A GPS receiver that will provide us with the latitude and longitude data.
Refer GPS Receiver Module in the Sensors and Modules section for information about GPS Receiver Module.
3. A Microsoft Azure account.
Refer Microsoft Azure Free Account Sign-Up in the Getting Started section of Microsoft Azure to create your free Microsoft Azure account if you do not already have one.
4. A Power BI account.
Create a Power BI account if you do not already have one. You can sign up on Power BI for free from the Microsoft Power BI site.
How to visualize the data in Power BI on a map is covered below in the later sections.
Let’s begin with the GPS location tracking system.
GPS Location Tracking System
The GPS location tracking system we are designing uses a GPS receiver module interfaced with a NodeMCU. The GPS receiver module can be from any manufacturer. The only necessary requirements are that the module should communicate using the UART communication and the GPS data must be available in standard NMEA string format. This is necessary because the code we have provided in the Source code section is based on these assumptions.

Interfacing Diagram for the Application
Here, we have used Mikal Hart’s TinyGPSPlus library from GitHub for the GPS code.
Download this library from here.
Extract the library and add it to the libraries folder path of Arduino IDE.
For information about how to add a custom library to the Arduino IDE and use examples from it, refer Adding Library To Arduino IDE in the Basics section of Arduino.
We have used functions from the TinyGPSPlus library for reading the latitude and longitude.
The nodeMCU periodically (We have used 10 seconds. You could change it according to your need) sends the latitude and longitude data received from the GPS receiver module to the Azure IoT Hub.
Refer Sending DHT11 sensor data to IoT Hub using NodeMCU in the Getting Started section of Microsoft Azure to know how to send data to an IoT Hub. The basic steps covered in this document are necessary before you proceed further. Once you have set up the Arduino IDE for NodeMCU board, have installed the libraries mentioned in the document whose link is given above, you can proceed further.
The code we will be using is available in the Source Code section at the end of this page.
Upload the code using the Arduino IDE to your NodeMCU device.
The code is a modification of the Sample application by Azure.
The code snippet for the GPS tracking used in the code is given below.
void readMessage(int messageId, char *payload)
{
    double lat_val, lng_val;
    smartDelay(1000); /* Generate precise delay of 1ms */
    lat_val = gps.location.lat(); /* Get latitude data */
    lng_val = gps.location.lng(); /* Get longtitude data */
    StaticJsonBuffer<MESSAGE_MAX_LEN> jsonBuffer;
    JsonObject &root = jsonBuffer.createObject();
    root["deviceId"] = DEVICE_ID;
    root["messageId"] = messageId;

    // NAN is not the valid json, change it to NULL
    if (std::isnan(lat_val))
    {
        root["latitude"] = NULL;
    }
    else
    {
        root["latitude"] = lat_val;

    }

    if (std::isnan(lng_val))
    {
        root["longitude"] = NULL;
    }
    else
    {
        root["longitude"] = lng_val;
    }
    root.printTo(payload, MESSAGE_MAX_LEN);
}
Now that our system is set up and is ready to send data to an IoT Hub, let’s set up the Microsoft Azure account to handle this data and process it according to our requirements.
You will have already set up your IoT Hub by now. If you have not, refer Creating an IoT Hub in Microsoft Azure in the Getting Started section of Microsoft Azure.
Now we need to add a consumer group to the IoT Hub, and create and configure a Stream Analytics Job to relay the IoT Hub data to the Power BI account.
Stream Analytics Job and Power BI
Refer Using Power BI to visualize real time data from IoT Hub in the Getting Started section of Microsoft Azure.
Follow the procedure in the document and add a consumer group to your IoT Hub. Create, configure and run a Stream Analytics Job following the procedure mentioned in the document.
Now proceed to visualize data on Power BI and create report as mentioned in the document. Instead of creating a line chart as created in that document, we will use the Map visualization of Power BI. How to select and configure the Map visualization is given below.
1. Select Map visualization from the Visualizations pane by double-clicking on the map icon.
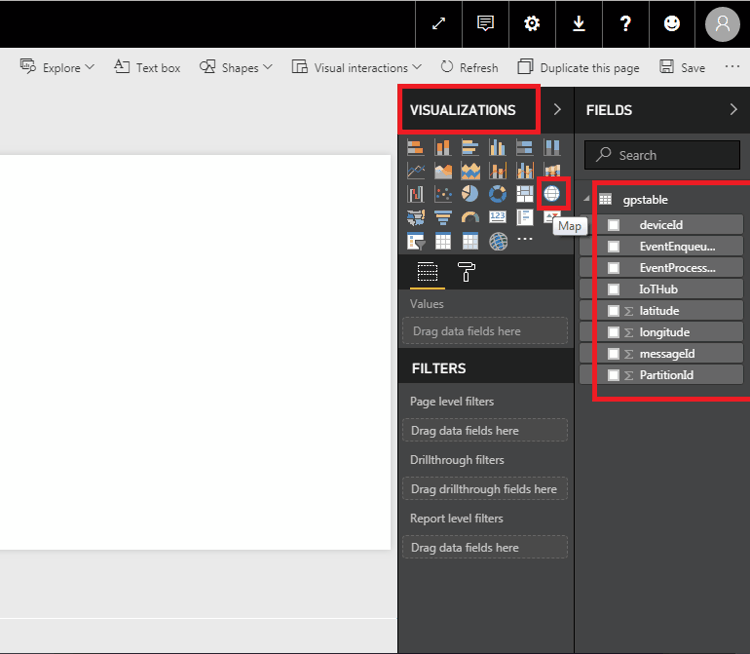
2. Click on the latitude, longitude, and EventEnqueuedUTCTime options as shown in the image below. You can either add them by clicking in the box next to them so that a tick mark appears, or you can drag the fields into the corresponding fields on the left side. EventEnqueuedUTCTime is used so that we can associate a time with each data point on the map.
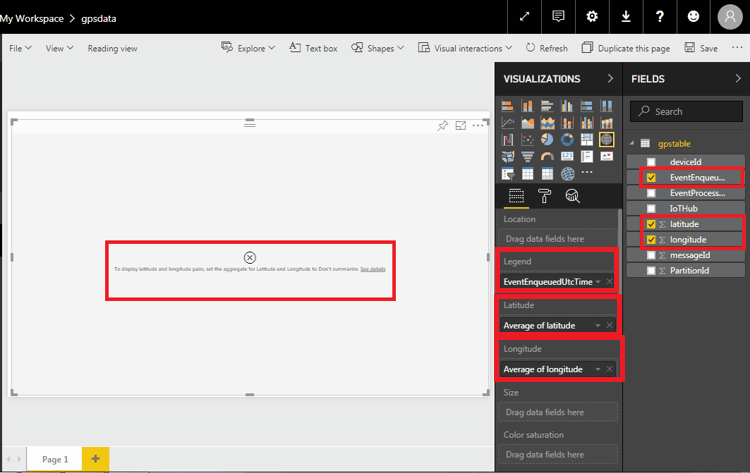
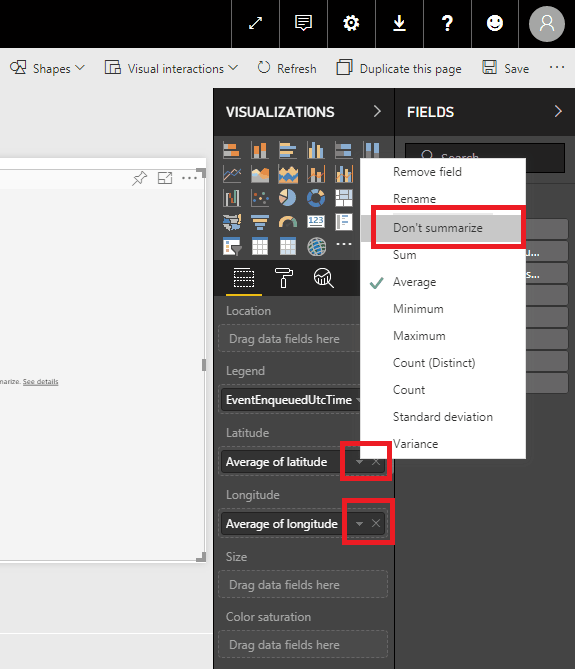
3. On completion of the above step, you will see a warning asking you to use Don’t summarize option for latitude and longitude. Select the Don’t summarize option for latitude and longitude as shown in the image below.
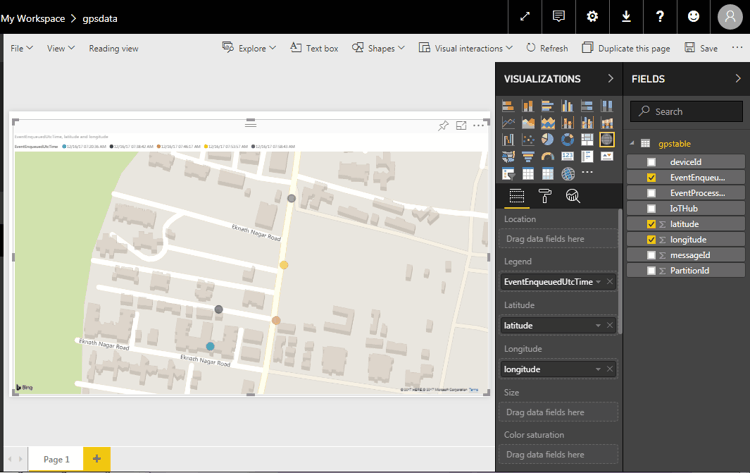
4. You will see the map with the data points (If data has been sent by the nodeMCU, else you will see a map without any points. Connect the nodeMCU and send data to see the changes in the map).
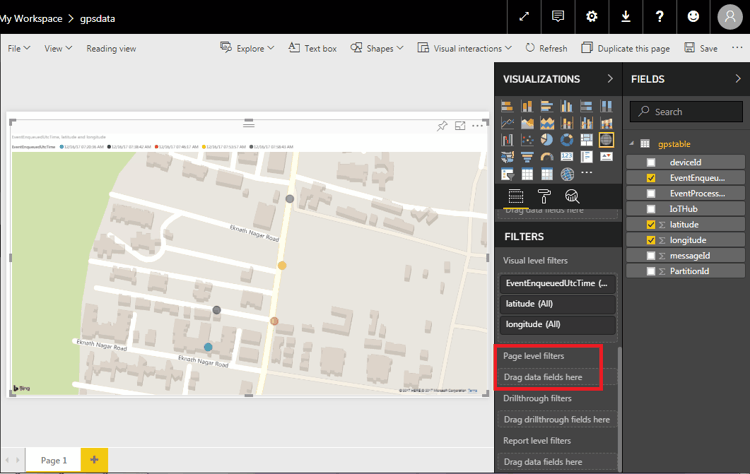
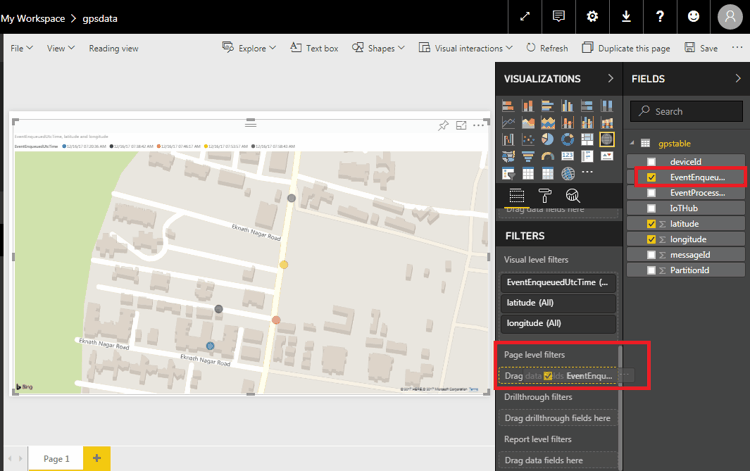
5. The Power BI stores all the data that has been sent by the IoT Hub. In order to view select data (say for a certain day, or certain hour, or some other specific time), we need to apply a filter to the data that has been received. We can apply the filter by dragging the EventEnqueuedUTCTime field into the Page level filters option on the left side.
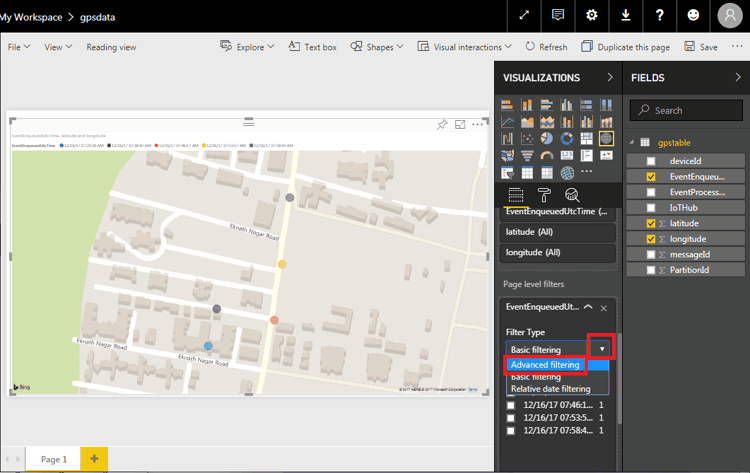
6. On doing so, we will be able to see Filter Type options. Select the Advanced Filters option from the drop-down present there.
7. On doing this, a new set of options will appear. Using these options we can choose specific dates, specific time duration on that day, or a specific time to filter the data. Various options are there to explore different possibilities of filtering. For example, in the image below, we have shown the is on or after option which selects the data that has arrived on or after the time and date selected. We can use the and/or radio button and another option like is on or before to limit the data to a select time duration.
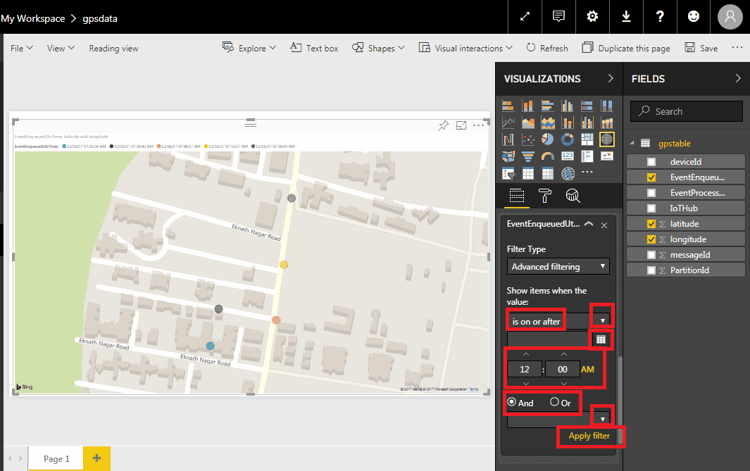
8. After selecting the options, click on Apply filter to enable filtering of the data. You will see the change in the data points on the map after doing so.
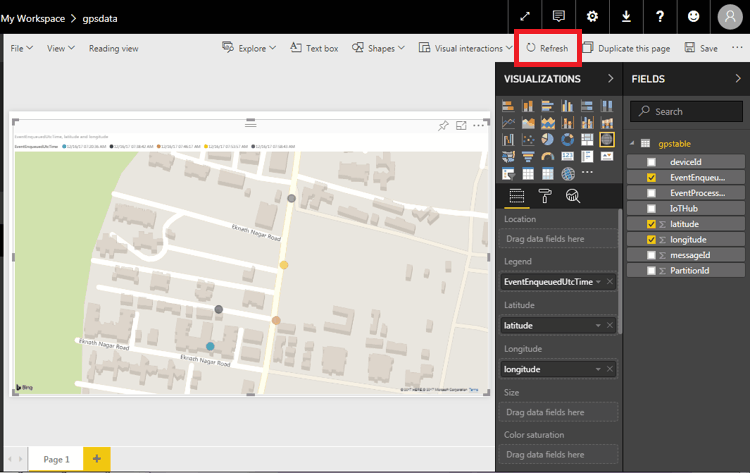
Note : The map on Power BI will not update on its own after receiving new data. This is because there is no refresh rate set. We can use the Refresh button to update the map. The button is shown highlighted in red in the image below and needs to be used in order to view new data points.
Output
![]()
Components Used |
||
|---|---|---|
| NodeMCU NodeMCUNodeMCU |
X 1 | |
| Ublox NEO-6m GPS Ublox Neo 6m GPS |
X 1 | |
Downloads |
||
|---|---|---|
|
|
GPS_Tracking_Application_NodeMCU_INO | Download |