Introduction
Power BI is a suite of business analytics tools by Microsoft. It can be used to visualize and analyze data from hundreds of data sources and get insights into the data.
This makes it useful for visualizing the data received by an IoT hub.
We can make use of the various visualization options available in Power BI to create a custom dashboard according to our application requirements and visualize the data within minutes.
For visualizing data from IoT Hub on Power BI, we will require an IoT Hub and an application that sends data to this IoT Hub.
If you do not already have a Microsoft Azure account, you can refer the topic Microsoft Azure Free Sign-Up in the basics section of Microsoft Azure.
If you have not created an IoT Hub already, you can refer the topic Creating an IoT Hub in Microsoft Azure in the basics section of Microsoft Azure.
If you do not have an application that sends data to your IoT Hub, you can refer the topic Sending DHT11 sensor data to IoT Hub using NodeMCU in the basics section of Microsoft Azure.
To visualize the data from an IoT Hub on Power BI, we will need to do the following:
- Make the IoT Hub ready for data access by adding a consumer group.
- Create, configure and run a Stream Analytics Job for transferring the IoT Hub data to a Power BI account.
Create a Power BI account if you do not already have one. You can sign up on Power BI for free from the Microsoft Power BI site.
Adding a Consumer Group to IoT Hub
Consumer groups are used by applications to pull data from the IoT Hub. (In this case, Stream Analytics Job is the application that will be pulling data from the IoT Hub)
Follow the steps given below to add a consumer to your IoT Hub :
1. Sign in to your Microsoft Azure account.
2. Open your IoT Hub. Click on Endpoints under Messaging.
3. In the window that appears after clicking on Endpoints, click on the built-in endpoint named Events. This is shown in the image given below.
4. A new window named Properties will open. In this window, find Consumer Groups and enter a name for a new consumer group and then click on Save at the top-left of that window.This is shown in the image given below.
.png)
Now that we have added a consumer group, we will create, configure and run a Stream Analytics Job.
Create, configure and run a Stream Analytics Job
Create a Stream Analytics Job
1. In your Azure Portal, select New --> Internet of Things --> Stream Analytics Job
.png)
2. A New Stream Analytics Job window will open. Fill in the details asked.
- Name : Choose a name for your job. The name must be globally unique. If the name is valid, a green check mark will appear.
- Resource Group : Select Use existing option and select the resource group that your IoT Hub uses.
- Location : Select same location as the one your IoT Hub uses.
- Select the Pin to dashboard for easy access of the resource.
3. Click Create.
It may take a few minutes to create the Stream Analytics Job.
You will get a notification on completion of creation of the Stream Analytics Job.
.png)
Add an Input to the Stream Analytics Job
1. Open the Stream Analytics job you created.
2. Click on Inputs. It is listed under Job Topology.
3. In the window that opens, click on Add.
.png)
4. A New Input window will open. Fill in the details asked.
- Input Alias : Unique alias for input. A green check mark will appear if it is valid.
- Source Type : Select Data Stream.
- Source : Select IoT Hub.
- Import Option : Choose Select IoT hub from your subscriptions option.
- IoT Hub : Choose your IoT Hub name.
- Endpoint : Select Messaging.
- Shared access policy name : Select iothubowner.
- Consumer group : Choose the consumer group you created earlier.
- Event Serialization Format : Select JSON.
- Encoding : Select UTF-8.
- Event compression type : Select None.
5. Click Create.
.png)
Add an Output to the Stream Analytics Job
1. Open the Stream Analytics job you created.
2. Click on Outputs. It is listed under Job Topology.
3. In the window that opens, click on Add.
.png)
4. A New Output window will open. Fill in the details asked.
- Input Alias : Unique alias for output. A green check mark will appear if it is valid.
- Sink : Select Power BI.
.png)
5. After selecting Sink as Power BI, Authorize option will appear. Click on Authorize.
6. A new tab will open in your browser and take you to a Microsoft sign-in page. Enter your credentials for Microsoft Power BI there and sign in.
7. The following options will appear in the New Output window after authorization.
- Group Workspace : Select My Workspace or any other target workspace.
- Dataset Name : Enter a name for the dataset.
- Table Name : Enter a name for the table.
8. Click Create.
.png)
Configure the Query of the Stream Analytics Job
1. Open the Stream Analytics job you created.
2. Click on Query. It is listed under Job Topology.
3. In the window that opens,
Replace [YourInputAlias] with the input alias of the job you created.
Replace [YourOutputAlias] with the output alias of the job you created.
4. Click Save on the top left of the window.
.png)
Run the Stream Analytics Job
1. Open the Stream Analytics Job from the dashboard.
2. Click on the Start button on the top left corner.
.png)
3. A new window will open. Select Job output start time as Now and click Start.
.png)
4. You will see that the Status changes from Created to Starting. And when the service has started, it changes to Running.
Visualize data on Power BI and Create Report
1. Connect your device which sends data to your IoT Hub.
2. Sign in to your Power BI account.
3. Go to the Group Workspace you selected when you created the output for the Stream Analytics Job. In our case, it was My Workspace.
.png)
4. Click on the name of the dataset you had created while making output for the Stream Analytics Job.
5. Click on the first icon under Actions for Create Report as shown in the image below.
.png)
6. A new window will appear as shown in the image below.
.png)
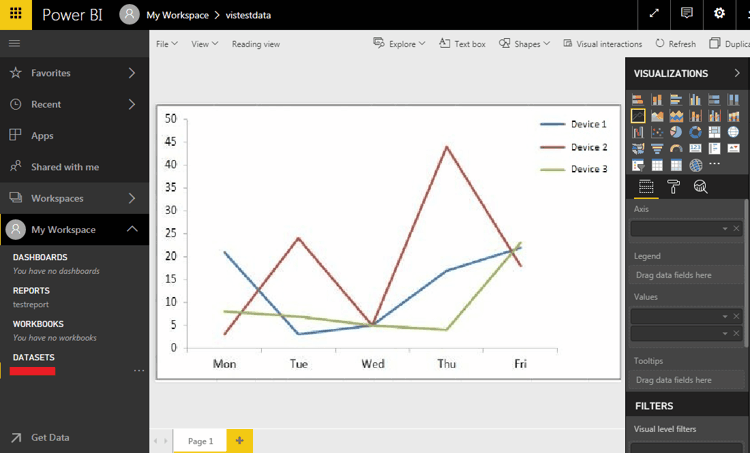
7. We will create a line chart to visualize the temperature and humidity data over time.
8. In the Visualizations pane, select the line chart.
9. In the Fields pane, expand the fields by clicking on the table name you had used while creating output for Stream Analytics Job. Select (click on the white box to check mark them) Humidity, Temperature, and EventEnqueuedUtcTime. You should see the data plotted on the line chart.
.png)
10. You can save the reports using the Save button at the top right corner.
11. For good measure, stop the Stream Analytics Job from your Azure portal by clicking the Stop button. (The Stop button is next to the Start button you used to start the Stream Analytics Job).